In vivo imaging

 and Photoacoustic (right) Coronal Images of Mouse Brain Post Ischemia/Hypoxia on Vevo F2 System; image by FUJIFILM VisualSonics")


In vivo imaging allows visualisation of both disease and treatment progression in non-terminal procedures. We offer a range of high-end techniques for this purpose.

Need help?
Send an email to phenotyping@biomed.au.dk
and we will get back to you as soon as possible.
Ultrasound, Vevo F2 LAZR-X
Applications in brief
Ultrasound is one of the most readily accessible clinical tools, applicable to a broad range of preclinical research including morphological and functional assessment of the heart and vessels. Microultrasound may be used to evaluate various organs as well as for embryology and oncology.
Features
For assesment of:
- flow velocity
- strain
Which species may I investigate?
The Vevo F2 LAZR-X system is located in the Skou Animal Facility, limiting the species to mice and rats.
Location
The Vevo F2 LAZR-X system is located in the Skou building animal facility, building 1115. Therefore, please familiarize yourself with guidelines and regulations regarding animals as well as user quarantine regulations.
Training and Manual
Training and Manual
Tips and Tricks
Tips and Tricks
More information
- For more information on Vevo F2 LAZR-X, go to Fujifilm Visualsonics.
Consider the eyes
- Following anaesthesia, ensure to protect the eyes of your animals from drying out by applying eye ointment with a clean cotton wool bud. Contact animal facility personnel for purchase of eye ointment.
Specifications
Specifications
| Full equipment name | Vevo F2 LAZR-X, Fujufilm Visualsonics |
| Transducer scan depths | 42 mm (UHF22x), 30 mm (UHF29x), 22 mm (UHF46x) |
| Transducer frequency and axial resolution |
|
| Fiber cables | 14 mm (680-970 nm), 24 mm (1200-2000 nm) |

Booking
Booking
Vevo F2 LAZR-X
- book the equipment in the Outlook calendar, 1116-K40E Vevo
-
For general information on booking procedures, go to Booking
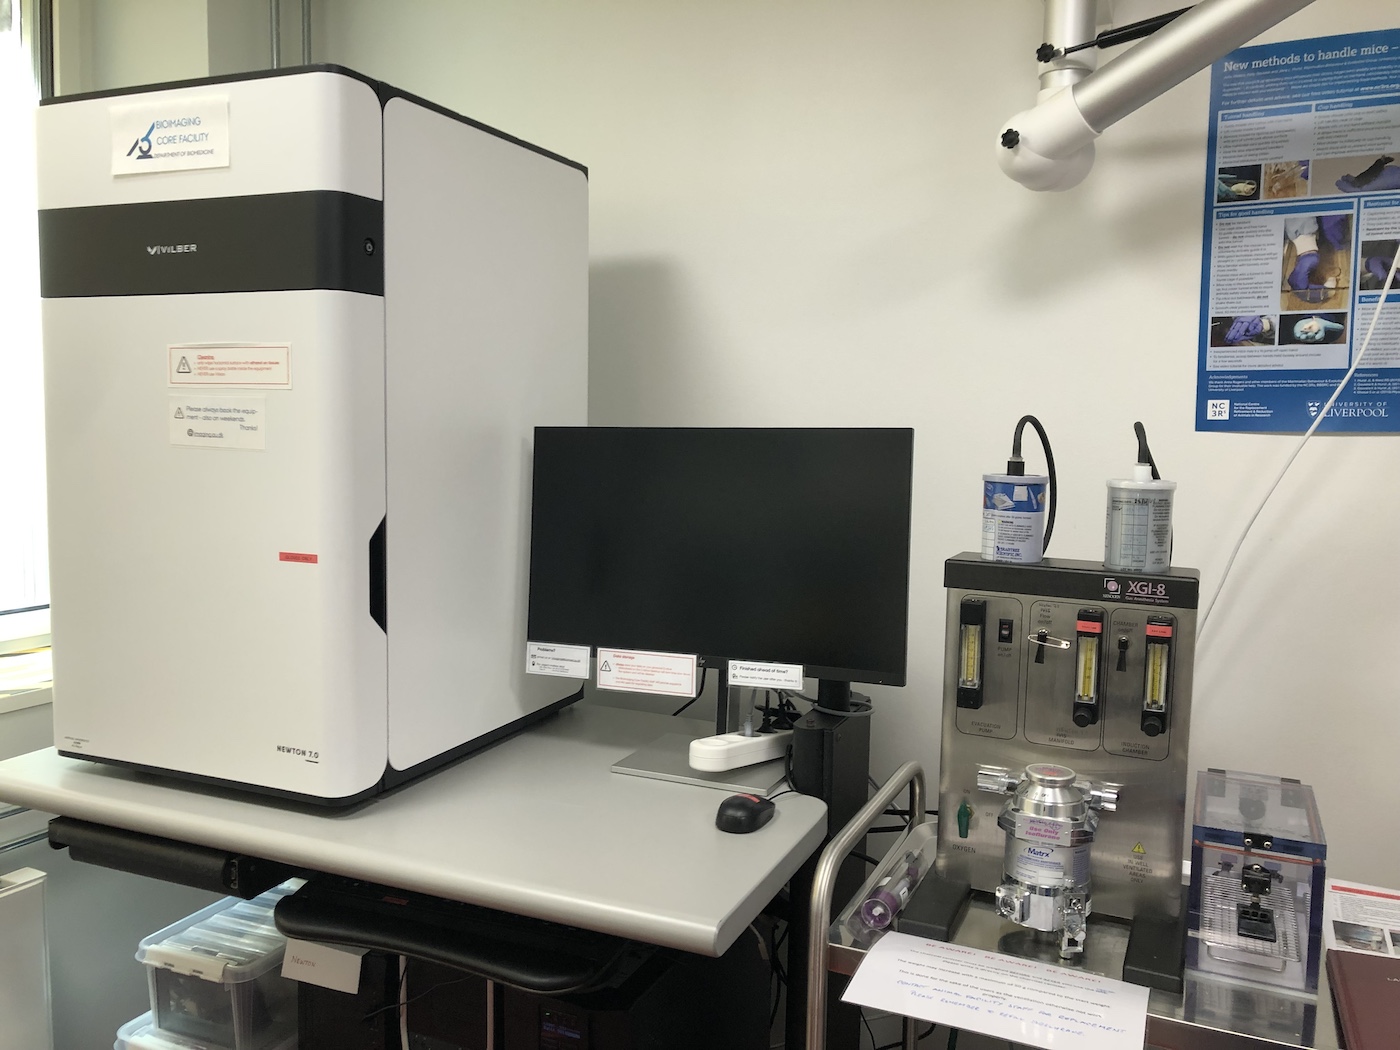
Newton 7.0 for bioluminescence and fluorescence
Applications in brief
Various bioluminescent reporters like firefly luciferase and many fluorescent molecular reagents can be used to visualize and track tumor, disease or inflammation development, target molecules to nanoparticles or follow biodistribution and pharmacokinetic studies within living aninals in a non-invasive manner.
Features
- Detection of bioluminescence and multispectral fluorescence
- Timelapse acquisition for real-time distribution studies
- 3D Bioluminescence Tomography (BLT) enhancing traditional planar 2D bioluminescence imaging into quantifiable three-dimensional output
- Co-registration with digital Organ & Bones atlas for digital anatomy reconstruction of the imaged animal in various postures
Which samples may I use?
Selected samples, but not limited to:
- live anesthetized mice (up to 5 simultaneously)
- live anesthetized rats (up to 3 simultaneously)
- dissected organs placed in e.g. standard petri dishes
Location
The Newton is placed in the Skou building animal facility. Therefore, please familiarize yourself with guidelines and regulations regarding animals and samples for imaging as well as user quarantine regulations.
Training and Manual
Training and Manual
Please note:
The Newton Software and Hardware Manual applies to a previous software version, hence there are some discrepancies.
A Quick-guide can be found on-site.
Tips and Tricks
Tips and Tricks
Bioluminescence and fluorescence in short
Bioluminescence imaging is based on endogenous production of light by expression of the enzyme luciferase upon reacting with the substrate luciferin in presence of oxygen and ATP. Since bioluminescent imaging does not require an excitation light source, the level of background (often caused by autofluorescence) is extremely low. Hence, bioluminescence imaging enables imaging of processes that produce minimal signal, e.g. lymphocyte trafficking or detection of small numbers of cancer cells.
Fluorescence results from a process that occurs in molecules known as fluorophores. Typically, acquisition of a fluorophore signal relies on excitation by an external light source. The fluorophore absorbs the excitation light, reaching a higher energy state. By returning to its former state, it emits fluorescent light. Fluorescence imaging is widely used for e.g. gene expression and protein detection.
Bioluminescence or fluorescence?
Absorption and scattering of light by water, lipids, ect. reduces tissue penetration depth of light, depending on the wavelength. These effects are more pronounced for fluorescence-based detection, where light is both required for excitation and is emitted. Using bioluminescence, it is possible to observe deep organs of experimental animals, e.g., liver, heart, or lungs, although signal intensity will vary depending on the amount of light emitted and organ depth.
For imaging under bone structures such as the brain and spinal cord, consider choosing a bioluminescence setup rather than fluorescence as these areas are difficult to illuminate sufficiently.
For deep penetration with fluorescence imaging, longer wavelength bands in the red range (650-900 nm) are recommended. This is due to the improved light transmittance afforded by the reduced scattering and absorption, as well as the higher signal-to-noise ratio owing to minimized interference from endogenous fluorophores (e.g. collagen and elastin which autofluoresce in the blue/green range)
- For studies quantifying tumor diameters, consider using 2D bioluminescence as opposed to 3D fluorescence. 3D fluorescence is ok for generating images but is rarely published like that.
- Bioluminescence and fluorescence imaging may also be combined in the same animal.
Which fluorophores are possible?
Consult our Specifications section for installed filters and filter bandwiths.
In case of multiple fluorophores, consult a spectra viewer to estimate the risk of cross-talk/bleed-through.
Inside the Newton
Consider placing the rodent so the area of interest is facing upwards, i.e. towards the top of the instrument.
In case of strong bioluminescence/fluorescence, consider using spacers between each animal. Spacers are located inside the door of the Newton.
Consider the eyes
Following anaesthesia, ensure to protect the eyes of your animals from drying out by applying eye ointment with a clean cotton wool bud. Contact animal facility personnel for purchase of eye ointment
Did my experiment work at all?
Obtain a quick image for swift evaluation by adjusting the binning settings.
Consider autofluorescence
For fluorescence-based studies, use a control mouse to investigate the degree of autofluorescence potentially masking fluorescence in the area of interest.
Autofluorescence in abdominal region: Consider alfalfa-free chow for 4-7 days prior to imaging to reduce autofluorescence caused by phytochromes in the abdominal region. Consult quick-guide on site for info on wavelengths. Consider emptying the bladder prior to imaging. Contact stable personnel for guidance.
Autofluorescence of fur: Consider removing the fur by shaving and/or depilatory cream and/or to work in the red spectrum. Fur autofluorescence may mask results particularly when detecting fluorescence in the blue-green spectrum. Consider the possibility of fur removal 24 h prior to imaging as mild skin inflammation caused by fur removal might affect distribution and/or activation of certain inflammation-targeted probes.
Autofluorescence of tail: Consider covering the tail with e.g. black paper (located on site in drawer under Newton) prior to imaging.
Spectral unmixing
Your fluorophores may have a significant overlap of excitation and emission spectra, also known as crosstalk or bleed-through. With SpectraViewer, you can determine overlap of your fluorophores. In case of overlap, you may have to consider spectral unmixing to be able to distinguish between the signals. Spectral unmixing can only be done on-site while acquiring the image.
If you need further spectal unmixing files, please contact the Phenotyping Core Facility for guidance.
Specifications
Specifications
| Full equipment name | Newton 7.0 FT500, Vilber |
| Camera | DarQ-9 1"Scientific CCD Sensor, 2160x2160 (4.6 MP) |
| Lens | f/0.70 |
| Fluorescence spectrum | 400>900nm |
| Fluorescent channels | 420 / 480 / 520 / 580 / 640 / 680 / 740 / 780 nm |
Filter bandwidths (narrow band-pass emission filters) | F-500 (530-550nm), F-550 (550-580nm), F-600 (580-640nm), F-650 (640-670nm), F-700 (690-720nm), F-750 (710-760nm), F-800 (800-840nm), F-850 (830-870nm) |
| Bioluminescence | yes |
| Field of view | 6 x 6 cm to 20 x 20 cm |
| Animal capacity | up to 5 mice or 3 rats simultaneously |
| Heated stage | yes, adjustable temperature |
FAQ
Animal Facility
- How do I get access to the Skou animal facility?
- How do I get access to the Skou animal facility?
- In order to access the Skou animal facility, you will need to book a training session with the stable personnel first. Please directly contact the stable personnel for this matter.
- Which samples may I bring to the stables?
- Which samples may I bring to the stables?
- You are NOT allowed to bring animals from other facilities to the Skou animal facility.
- Please contact the stable personnel for information on which and how to bring samples to the Skou animal facility.
Equipment
- Which isoflurane settings should I use?
- Which isoflurane settings should I use?
- Follow isoflurane anesthesia-guides located next to the isoflurane equipment.
- The oxygen carrier (white container on wheels on the floor) adjusts its flow automatically according to your isoflurane settings. Please do not adjust oxygen carrier setting.
- Isoflurane vaporizor (adjustable by turning the wheel/top): 4-5% for induction chamber, 2,5-3% for maintenance in nose cones
- Isoflurane induction flow (for initial anesthesia in induction chamber): 1 L/min
- Isoflurane flowmeter (labelled 'manifolder', i.e. supplies the Newton with isoflurane): 1-1.5 L/min. The isoflurane flowmeter does not need to be adjusted according to number of nose cones in use.
- Isoflurane settings may need to be adjusted according to particular species or strains of animals.
- My animal keeps waking up inside the Newton, what can I do?
- My animal keeps waking up inside the Newton, what can I do?
- Follow isoflurane anesthesia-guides located next to the isoflurane equipment.
- Isoflurane settings may need to be adjusted according to particular species or strains of animals.
- Ensure that the animal is sufficiently anesthetised in the induction chamber prior to transfer to the nose cone. This may take 2-5 min.
- Ensure that the nose of the animal is placed as close as possible to the isoflurane entry site inside the nose cone (at the very back of the nose cone). Even a small distance to the isoflurane entry site results in much lower isoflurane amounts.
- Consider turning on the isoflurane flow towards the Newton half a minute prior to moving the animal from the induction chamber to the nose cone, ensuring that isoflurane has already reached the nose cone prior to moving the animal. No need to adjust vaporiser setting for this.
- How should I clean the equipment after use?
- How should I clean the equipment after use?
- After use, please clean the instrument (stage and nose cones) by wiping with water and ethanol on a tissue. Never use Virkon (pink fluid) as it damages the surface of the instrument and generates background fluorescence.
- Do not spray liquids inside the instrument as this may damage light sources, electrical components and the camera lens.
- Please leave the work station neat and clean for the next user.
- How shall I leave the isoflurane equipment?
- How shall I leave the isoflurane equipment?
Follow the step-by-step guide next to the isoflurane equipment.
Please make sure to:
- refill the isoflurane container
- weigh the isoflurane scavengers
- write the weight of the isoflurane scavenger on the scavenger lable
- ensure to contact the stable personnel if the scavenger has to be replaced
- Is isoflurane included in the price?
- Is isoflurane included in the price?
- Isoflurane is not included in the price for booking of the Newton 7.0 via the Phenotyping Core Facility. Please contact the stable personnel for guidance on purchasing and storage of isoflurane.
- I am pregnant or planning a pregnancy. Is it safe to use the Newton 7.0?
- I am pregnant or planning a pregnancy. Is it safe to use the Newton 7.0?
- As isoflurane is harmful for the foetus, please ensure that you comply to all safety measures needed. If in doubt, contact the stable personnel for guidance and protective equipment.
Data Storage
- How can I get access to my data?
- How can I get access to my data?
- After using the Newton, please transfer your data immediately to your personal AU drive (O:) and clean up your local directories on instrument PCs if you are not reusing data in subsequent experiments.
- The Phenotyping Core Facility staff will provide support to non-AU users for exporting data.
- Use of USB memory sticks or external hard drives is for security reasons not allowed.
- Does the Phenotyping Core Facility regularly back up the user data?
- Does the Phenotyping Core Facility regularly back up the user data?
The Phenotyping Core Faility is not responsible for your data. DATA ON LOCAL PC DRIVES WILL BE DELETED ON A REGULAR BASIS in order to keep the systems performing optimally.
Please ensure that you transfer your data to your personal AU drive (O:) after each session.
- May I use my personal USB memory stick or external hard drive for data storage?
- May I use my personal USB memory stick or external hard drive for data storage?
No, any use of USB memory sticks or external hard drives is for security reasons not allowed. Usage of USB memory sticks may lead to suspension of your user license.
Data Analysis
- How may I process and analyse my data?
- How may I process and analyse my data?
- Obtained images may be processed and analysed using the freeware Kuant. Contact The Phenotyping Core Facility for download.
- Kuant is only compatible with Windows.
Publications
- How shall I refer to the equipment?
- How shall I refer to the equipment?
- The purchase of the Newton 7.0 has been possible by a grant from the Carlsberg Foundation. Please acknowledge the Carlsberg Foundation (CF23-1388) in publications.
- Please also ensure to acknowledge the Phenotyping Core Facility. For guidance consult Publications & Acknowledgements.
Booking
Booking
- To ensure that the room, in which the Newton 7.0 is located, is not blocked by other activities, please always book the Newton 7.0 as well as the room itself via your Outlook calendar. Add the Newton as well as the room in the 'invite person' field. In case of doubts on how to book the room, contact IT Support.
- The Newton 7.0 is called 1115-K18A Newton scanner
- The room is called 1115-K18A Lab bench/Downdraft table
-
For general information on booking procedures, go to Booking
MicroPET
Positron emission tomography (PET) is an imaging technique that uses radioactive substances to visualize and trace metabolic processes; As a radioactive compound is injected, blood flow, metabolism and target organs can subsequently be monitored. PET is thus ideal when determining how a compound is metabolized, or to identify metabolically active tissues (e.g. cancer). A microPET machine is available for scanning of rodents. The technique provides real-time 3D images from anaesthetized animals.
Hyperpolarized MRI
This modality uses traditional MRI technique, but with an injection of endogenous molecules that have been hyperpolarized (meaning they have been “charged”, almost like a magnet). The hyperpolarization creates an increased MRI-signal, thus making it possible to track the molecule after injection. Typically 13C-labelled probes (like 13pyruvate) are used, and so real-time in vivo cellular metabolic events can be monitored, simultaneously as spatial information is obtained.
Booking
Booking
MicroPET and Hyperpolarized MRI
- contact us on phenotyping@biomed.au.dk for further guidance on booking